Memphis apartment submarkets differ sharply from one another: in early 2024, HUD’s market analysis found apartment vacancy below 6% in suburban Collierville but above 23% in Frayser and Raleigh, with Downtown, East Memphis and Southeast Memphis spread out in between. Where a building sits inside the city, and whether it is inside the city at all, shapes its rents, its tenant base, its vacancy and even its tax bill.
This guide walks through the main parts of Memphis using official and published sources, starting with the citywide numbers, then moving area by area through the neighborhoods and building types that make up the local apartment stock. A few cautions run throughout. HUD’s figures come from a June 2024 report and are now more than two years old. Market areas used by data providers do not line up exactly with neighborhood names that residents use. And several places with Memphis mailing addresses are separate towns or unincorporated county land.
The citywide picture
Memphis is the largest of seven incorporated municipalities in Shelby County. The others are Arlington, Bartlett, Collierville, Germantown, Lakeland and Millington, according to the University of Tennessee’s County Technical Assistance Service directory for Shelby County. Each is a separate municipality, so a building in Germantown or Bartlett answers to a different city government from one a few blocks away inside Memphis.
The Census Bureau’s QuickFacts profile for Memphis shows 633,104 residents at the April 2020 Census and an estimated 609,647 on July 1, 2025, a decline of roughly 3.7%. The owner-occupied housing rate for 2020–2024 was 44.9%, which means a majority of the city’s occupied homes are rented. Median gross rent over the same period was $1,181, and the median value of an owner-occupied home was $169,000.
Those numbers describe a renter-majority city with modest home values and a shrinking population count. For apartment owners, that combination tends to mean steady demand for affordable units alongside real competition for tenants, especially in areas where new supply has been added.
How HUD reads the Memphis apartment market
The most detailed official look at local apartment conditions is HUD’s 2024 Comprehensive Housing Market Analysis for the Memphis area, which covers the metro area across Tennessee, Mississippi and Arkansas and is dated June 1, 2024. HUD described the overall rental market as slightly soft, with an overall rental vacancy rate of 11.7%. For professionally managed apartments, the vacancy rate was 13.8% in the first quarter of 2024, up 0.9 percentage points from a year earlier, and the average rent was $1,125, up less than 1%.
HUD also noted that 1,950 rental units were under construction and said those units “are expected to satisfy most of the demand during the forecast period.” In other words, the federal analysts did not see a need for a large new wave of construction beyond what was already underway.
A more recent private reading points the same way. RealPage reported in April 2026 that Memphis had about 94% occupancy in March 2026, placing it in the bottom ten among large markets, with average rent of $1,237, down 2.8% from a year earlier. RealPage also counted fewer than 90 units under construction. Occupancy and vacancy are measured differently by HUD’s data source and by RealPage, so the two figures should not be compared directly, but both describe a market where supply has caught up with demand and rent growth has stalled.
What the market areas show
HUD’s report breaks the metro into 19 apartment market areas defined by CoStar. Several of them line up with familiar parts of Memphis, and the spread between them is the clearest way to see how different the submarkets are:
- Frayser/Raleigh, in the northern part of the city, had the highest vacancy in the metro at 23.5%, up from 20.8% a year earlier.
- Southeast Memphis, which takes in the Hickory Hill area, had vacancy of 19.5%, up from 17.9%.
- Downtown Memphis had vacancy of 12.8%, down slightly from 13.2%, and the highest average rent among the city areas listed, $1,452, after a 2% decline.
- East Memphis had an average rent of $1,050 after a 3% decline.
- North Memphis saw rents rise 7% to an average of $1,338.
For contrast, suburban Collierville had vacancy of 5.5% and an average rent of $1,717, while Tipton County and Tate County, farther out, had the lowest vacancy rates in the metro at 3.8% and 3.9%. The pattern is plain: the outer suburbs were tight and expensive, while several older city submarkets carried high vacancy.
Downtown, South Main and Harbor Town
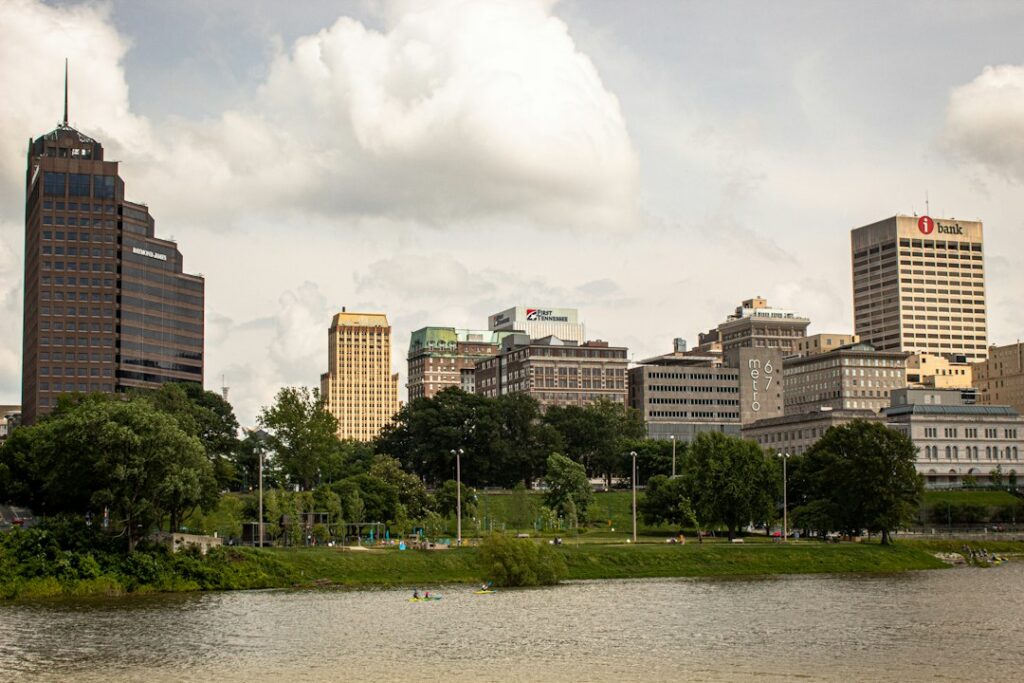
Downtown Memphis, including the South Main area, is the city’s central residential district. The Downtown Memphis Commission’s FY26 budget presentation, from June 2025, listed more than 25,000 downtown residents as of 2024.
The HUD figures above show Downtown carrying the highest average rent among the city market areas, but also double-digit vacancy. That combination usually points to a submarket where newer buildings are competing with one another for the same renters, and where concessions can matter as much as asking rents. Owners of older downtown buildings should expect to compete on price, location and unit layout against newer product.
Harbor Town, on Mud Island, is a different kind of neighborhood. The Congress for the New Urbanism describes it as a 132-acre new-urbanist community developed by Henry Turley, with construction starting in 1989 and finishing in 2004. It has “over 500 residences” ranging “from mansions to affordable apartments.” That mix of building types in one planned neighborhood is unusual in Memphis, where most areas are dominated by one housing type.
Midtown’s historic districts
Midtown sits between downtown and East Memphis, and its housing stock is defined by early twentieth-century neighborhoods. Two of the best-known are on the National Register of Historic Places:
- Central Gardens was listed in 1982 and covers about 83 blocks, 1,540 structures and 511 acres. Most of its homes are single-family houses built between 1900 and 1930, with some multifamily buildings mixed in.
- Cooper-Young was added to the National Register in 1989. Its housing is dominated by Victorian and Craftsman houses built roughly between 1900 and 1915.
For apartment owners, Midtown’s historic districts mostly mean small buildings, such as duplexes, fourplexes and older apartment buildings tucked among the single-family homes, rather than large garden complexes. These properties often trade on location and character, and their renters tend to value walkability and older architecture. Renovation and exterior work can be more involved in historic areas, so owners should check whether a building falls inside a locally designated district before planning changes.
Crosstown and the Medical District
Two large redevelopment efforts have added or planned new apartments on Midtown’s edges. Crosstown Concourse, a former Sears distribution center, opened in 2017 after a $200 million redevelopment, according to the Urban Land Institute, with residents filling 265 apartments across the upper four floors. The building mixes housing with health care, education, offices and retail, and its success has drawn attention to the surrounding Crosstown and Binghampton area.
The Memphis Medical District, between downtown and Midtown, is home to major hospital and university campuses. The Memphis Medical District Collaborative was established in 2016 to support investment in the area. In June 2025, developers of a project called The BLVD announced plans that included 603 multifamily units as part of a larger mixed-use investment, according to local television coverage; no construction timeline was reported. Medical district renters include students, residents, nurses and staff, a tenant base that values proximity to work and tends to turn over on academic and training cycles.
East Memphis and the University of Memphis area
East Memphis is one of the market areas HUD tracks separately. Its figures show East Memphis rents averaging $1,050 in early 2024 after a 3% decline, well below Downtown at $1,452 and suburban Collierville at $1,717. A gap that wide usually means a submarket competing on price rather than amenities, where renovation can make a building stand out but where rent growth is harder to achieve.
The University of Memphis, east of Midtown, reported fall 2025 enrollment of 19,652 students. Not all of them rent off campus, but the university supports a cluster of student-oriented and workforce rentals in the surrounding neighborhoods. Owners near campus should expect leasing to follow the academic calendar and should plan turnover and repairs around the summer.
Frayser, Raleigh, Whitehaven and the northern and southern edges
The highest vacancy rates in HUD’s report were in the city’s outer neighborhoods. Frayser and Raleigh, in the north, posted 23.5% vacancy in early 2024. Southeast Memphis, including Hickory Hill, was at 19.5%. Whitehaven, in the south, did not have a separate figure in the parts of HUD’s report summarized here, so owners there should rely on property-level data.
These areas contain much of the city’s lower-rent apartment stock. High vacancy there can reflect several things at once: older buildings needing capital investment, weaker household incomes, and competition from newer complexes elsewhere. For owners, these submarkets typically mean higher operating risk and heavier capital needs, and they reward careful underwriting of actual collections rather than scheduled rent.
Annexation and the Cordova question
City boundaries matter in this part of Memphis. Shelby County’s list of Memphis annexations since 1998 shows Hickory Hill becoming part of the city effective December 31, 1998, South Cordova on July 1, 2012, and Southwind-Windyke on December 31, 2013. Then the direction reversed. As of New Year’s Day 2021, South Cordova, Southwind-Windyke and Rocky Point were de-annexed and left the city, according to local news coverage. South Cordova alone had about 4,146 residents.
The practical result is that “Cordova” is now split between the City of Memphis and unincorporated Shelby County. A property’s address does not tell you which side of the line it is on. Owners should confirm a building’s jurisdiction with the county assessor before estimating taxes, code requirements or city services.
Rules that apply across every Memphis submarket
Some rules apply the same way regardless of neighborhood, and they affect how buildings in every submarket are valued.
The most important is property tax classification. The City of Memphis treasury page explains that commercial and industrial property is assessed at 40% of appraised value and residential property at 25%. Under Tennessee law, property with two or more rental units is taxed as commercial. The University of Tennessee’s explanation of Tennessee’s property classification rules describes “taxing real property containing two or more rental units based on 40 percent of its value.” A duplex and a 200-unit complex are therefore both assessed at the commercial ratio, while a single rental house is assessed at the residential ratio.
Shelby County completed a reappraisal in 2025, the first since 2021. Local coverage at the time reported that home values had risen an average of about 25% over the previous four years, and noted that Tennessee law requires tax rates to fall proportionally when overall appraisals rise, so a higher appraisal does not automatically mean a proportionally higher bill. Owners should compare their own appraisal change against the change in the rate rather than assuming one tracks the other. Our guide to rent control and property tax by state puts Tennessee’s approach in national context.
Code enforcement is handled by the city’s Division of Neighborhood Improvement, which says its condemnation work “addresses dilapidated housing by issuing board-ups, overseeing court ordered demolitions, and referrals for the Neighborhood Preservation Act.” Memphis has not adopted a citywide rental registry. Local reporting by MLK50 in 2022 described how code enforcement staff drafted a rental registry and landlord licensing ordinance, and how a 2021 state law limiting local regulation of rental property stalled the effort.
Finally, the city’s long-range plan, Memphis 3.0, shapes where new development is encouraged. The plan was adopted by the City Council in December 2019, and the American Planning Association’s summary of the Memphis 3.0 comprehensive plan describes its “build up, not out” theme and its focus on walkable neighborhood anchors. In 2024 the city sought proposals to update its Unified Development Code to better align with the plan.
Practical takeaways across Memphis apartment submarkets
The data points to a few practical conclusions for people who own or are evaluating apartment buildings in Memphis:
- Location within the city drives risk. Vacancy ranged from under 13% Downtown to above 23% in Frayser and Raleigh in HUD’s 2024 report. Underwriting that applies a citywide vacancy assumption to a specific building can be badly off in either direction.
- Confirm the jurisdiction. Annexation and de-annexation have moved city lines several times since 1998. Check whether a building is in Memphis, another town or unincorporated county before relying on tax or code assumptions.
- Expect commercial assessment. Buildings with two or more rental units are assessed at 40% of appraised value. Model taxes after a sale using the new appraisal, not the seller’s current bill.
- Match the plan to the stock. Midtown’s small historic buildings, price-competitive East Memphis properties and Downtown’s newer buildings each have different capital needs and tenant profiles.
- Watch rent trends, not just occupancy. RealPage’s 2026 data shows occupancy holding near 94% while rents fell, so effective rent and concessions matter more than headline occupancy.
Owners thinking about their next move can find local context and recent posts on our page about selling an apartment building in Memphis, and statewide context on our Tennessee market page.
Reading the Memphis map as an owner
Memphis is best understood as a collection of very different apartment markets that happen to share a city government. Downtown commands the highest rents among the city areas HUD tracks, with real competition between buildings. Midtown offers smaller, older buildings with historic character. East Memphis competes on price. The northern and southeastern neighborhoods carry the highest vacancy and the heaviest capital needs. Across all of them, the 40% commercial assessment ratio, a shifting city boundary and a soft rent environment shape the numbers. Owners who start with the specific submarket and the specific building, rather than citywide averages, will have a far clearer view of what a property is worth and how it is likely to perform.