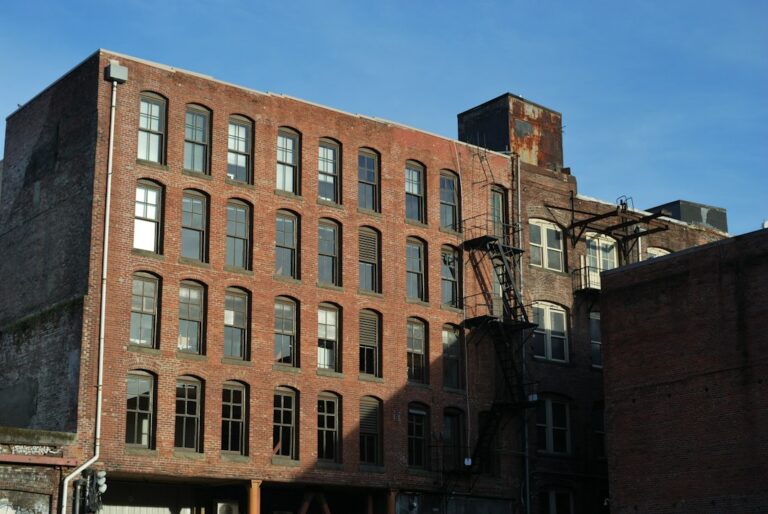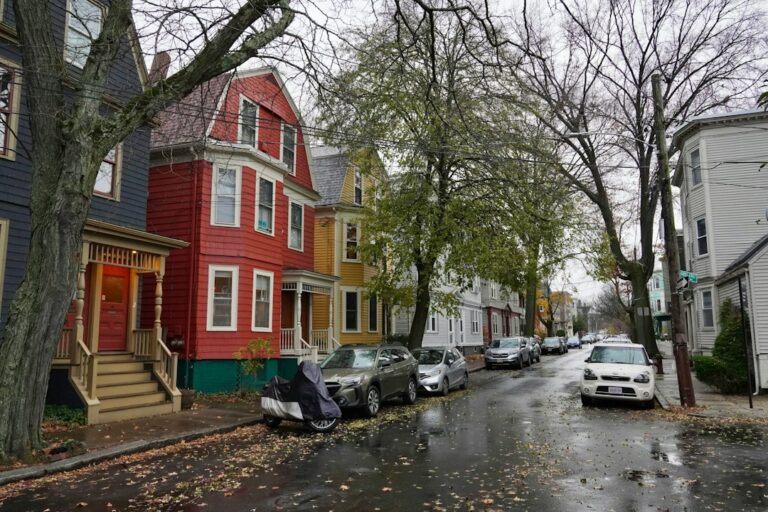
Springfield apartment neighborhoods fall into three broad groups: a downtown core of towers, conversions and subsidized complexes where almost nobody owns; a ring of older neighborhoods such as the South End, the North End, Forest Park and the Mason Square area, where brick apartment blocks sit beside two- and three-family houses; and outer neighborhoods that are mostly owner-occupied. Knowing which group a building sits in tells an owner a great deal about its tenants, its competition and its capital needs.
The city officially recognizes 17 neighborhoods, and the Pioneer Valley Planning Commission has published detailed neighborhood investment plans for many of them since 2024. This guide uses those plans, city housing documents and Census data to walk through the apartment stock in each part of the city.
How Springfield apartment neighborhoods break down
According to the city’s neighborhood profiles and the planning commission, Springfield’s official neighborhoods are Bay, Boston Road, Brightwood, East Forest Park, East Springfield, Forest Park, Indian Orchard, Liberty Heights, McKnight, Memorial Square, Metro Center, Old Hill, Pine Point, Six Corners, Sixteen Acres, South End and Upper Hill. Locals also use names that are not official neighborhoods: the North End means Brightwood and Memorial Square together, and Mason Square refers to the area around McKnight, Bay, Old Hill and Upper Hill.
Citywide, the Census Bureau’s QuickFacts profile for Springfield shows 155,929 residents in the 2020 Census and an estimated 154,702 on July 1, 2025. The owner-occupied housing rate for 2020 to 2024 was 49.6%, so about half of all occupied homes are rented. Median gross rent over the same period was $1,144, and the median owner-occupied home was valued at $245,000.
That citywide average hides enormous variation. Homeownership in the planning commission’s neighborhood data ranges from about 1% in Metro Center to more than 40% in Forest Park and Indian Orchard, and the city’s older profiles put it well above 70% in East Forest Park and Sixteen Acres.
A housing stock built before 1950
Springfield’s apartment buildings are old. The city’s 2020 to 2024 Consolidated Plan, drawing on 2011 to 2015 Census survey data, found that 53% of the city’s housing units were built before 1950 and 73% before 1980. Among renter-occupied units, 52% dated from before 1950.
The same plan breaks down the 61,615 units counted by building type:
- Single-family detached: 44%.
- Single-family attached: 4%.
- Buildings of two to four units: 30%.
- Buildings of five to 19 units: 11%.
- Buildings of 20 or more units: 10%.
In other words, about one in five units sits in a building of five or more apartments, while the two-to-four-unit category, which covers Springfield’s many two-families and three-deckers, is larger than both combined. An investor looking for 5-plus-unit buildings is working within a smaller slice of the stock than the renter share suggests.
Public and subsidized housing also shapes the market. The Consolidated Plan lists the Springfield Housing Authority’s 1,809 federal public housing units in 19 developments and 524 state-aided units in nine developments, along with 2,574 Housing Choice Vouchers administered by the authority and another 2,528 by the regional nonprofit Way Finders. Voucher holders rent from private owners, so they are a meaningful part of the tenant base for many older buildings.
Metro Center: towers, conversions and historic rowhouses
Metro Center, the downtown neighborhood, is the most renter-dominated part of the city. The planning commission’s Metro Center plan counts 5,874 residents and a homeownership rate of 1.1%, the lowest in Springfield. About 77% of housing units are in buildings of 20 or more units, and only 5% are in one- to three-unit buildings. Roughly 1,860 units, about half the neighborhood’s stock, are subsidized.
The housing ranges from 19th-century brick rowhouses on Mattoon Street to the converted Milton Bradley factory. Local historic districts include Quadrangle-Mattoon, designated in 1972, along with the Apremont Triangle, Lower Maple and Federal Square-Upper State Street districts.
Two large projects show where downtown is heading:
- 31 Elm Street, the former Court Square Hotel, reopened in April 2024 with 74 apartments after about 30 years of vacancy, according to MassHousing and WAMC. WinnDevelopment and Opal redeveloped it with 59 market-rate units and 15 workforce units for households up to 80% of area median income.
- Skyview Downtown, formerly Chestnut Park, includes a 33-story tower built in 1977. Related Companies completed a $50 million renovation in October 2021 of its 489 units, of which 412 serve households at up to 60% of area median income and 77 are workforce units.
Downtown also has the city’s two largest recent anchors. MGM Springfield opened on August 24, 2018, a $960 million casino resort covering about 14.5 acres on Main Street at the northern edge of the South End. Union Station reopened in June 2017 after a roughly $95 million restoration, and the CTrail Hartford Line began serving it on June 16, 2018.
For a private owner of a mid-size downtown building, that mix cuts both ways. Half the neighborhood’s units carry income limits, so a market-rate building competes for a smaller pool of unrestricted renters, but the 31 Elm conversion, with 59 market-rate units, shows developers and lenders betting that renters will pay for well-finished downtown units near Court Square, the casino and the rail station. Buildings that sit between those two worlds, older and unrenovated but unsubsidized, face the hardest positioning question.
Lower Liberty Heights
Just north of downtown, the planning area known as Lower Liberty Heights, which spans parts of Metro Center and Liberty Heights, has 2,699 residents and 1,177 housing units, 57% of them in buildings of 20 or more units. The Springfield Housing Authority’s Saab Court has 288 units in three high-rises, and Chestnut Crossing, in the former YMCA at 275 Chestnut Street, has 101 studio apartments.
The South End and Outing Park
The South End is Springfield’s smallest neighborhood by population, with 2,736 residents and a homeownership rate of 13.3%, according to the planning commission’s South End plan. Its 1,479 housing units are split roughly evenly between one- to three-unit buildings (37%), buildings of four to 20 units (37%) and buildings of 20 or more units (26%). About 95% were built before 1939.
The neighborhood’s best-known apartment district is Outing Park, a group of early 20th-century brick apartment buildings on Oswego, Bayonne and Niagara Streets and Dwight Street Extension. Of the 44 buildings originally constructed between 1914 and 1926, 23 survive. They were restored by First Resource in a project completed in 2015 at a cost of about $72 million, producing 316 mostly subsidized units, and the area was listed on the National Register of Historic Places in 2012.
The South End was also one of the neighborhoods hit hardest by the June 1, 2011 tornado. A city disaster recovery report counted 242 units in 30 buildings condemned and 99 units destroyed in Metro Center and the South End together. The Rebuild Springfield master plan released in February 2012 focused on the South End, Maple High-Six Corners and East Forest Park.
The North End: Brightwood and Memorial Square
North of downtown, Brightwood and Memorial Square together form the North End. The planning commission’s North End plan counts 3,902 residents in Brightwood and 4,257 in Memorial Square, with homeownership rates of 16.0% and 9.3%.
The apartment stock here is concentrated in large complexes. About two-thirds of Brightwood’s units are in complexes of 200 or more units. In Memorial Square, about 30% of units are in buildings of six to 43 units and 22% are in buildings of 100 or more. Across the two neighborhoods, 1,394 units are subsidized. The plan also describes a proposed conversion of the former Brightwood Elementary School into 57 apartments.
For private owners, the North End is a market where mid-size walk-ups compete with large subsidized communities. Rent levels, voucher acceptance and building condition tend to matter more than amenities.
Forest Park, the city’s largest neighborhood
Forest Park, named for the large city park within its borders, is Springfield’s largest neighborhood, with 26,176 residents and a homeownership rate of 43.9%, according to the planning commission’s Forest Park neighborhood investment plan. Its 10,021 housing units break down as follows:
- Single-family homes: 31%.
- Two-family homes: 37%.
- Three-family homes: 11%.
- Buildings of four to nine units: 7%.
- Buildings of 10 to 19 units: 4%.
- Buildings of 20 or more units: 10%.
The median year built is 1919, and more than 88% of units were built by 1939. The Forest Park Heights Historic District covers 204 acres of Queen Anne, Colonial Revival and Tudor Revival homes and is listed on the National Register. The Springfield Housing Authority’s Forest Park Manor has 116 units.
Because of its size, Forest Park holds a large share of the city’s mid-size apartment buildings even though they are a minority of its own stock. Its 4-to-19-unit buildings, about 11% of 10,021 units, add up to more than 1,000 apartments in a neighborhood where owner-occupants are close to half of all households.
Mason Square and Maple High-Six Corners
The neighborhoods around Mason Square have very different profiles:
- McKnight, with 4,859 residents and a homeownership rate of 31%, is known for large late-1800s Victorian homes. It became a local historic district and was listed on the National Register in 1976, and the city’s earlier profile describes it as the region’s first fully planned residential area.
- Upper Hill has 7,845 residents and a homeownership rate of 40.2%, with housing that is mostly two-family homes.
- Old Hill has 4,351 residents and a homeownership rate of 23.2%.
- Bay has 4,269 residents and a homeownership rate of 32.8%, and includes the housing authority’s Reed Village.
The largest apartment project in the area is the conversion of the former Indian Motocycle factory complex. A 139-apartment building already existed on the site, and First Resource added 60 more units, 45 in the main factory and 15 in the old Mason Square fire station, at a cost of about $35 million, as WAMC reported in 2019.
Maple High-Six Corners has 7,510 residents and a homeownership rate of 16.8%. Its housing is largely 19th century and includes the Maple Hill and Ridgewood local historic districts. The 2011 tornado hit hardest along Central Street, and the neighborhood was one of the three focus areas of the Rebuild Springfield plan.
Indian Orchard’s mill-village housing
Indian Orchard began as a mill village. The planning commission’s Indian Orchard plan notes that the canal was built in 1846, the first mill opened in 1854 and the Indian Orchard Mills Company built housing for its workers. Today the neighborhood has 8,527 residents and a homeownership rate of 44.8%.
Its 3,523 housing units include 38% single-family homes, 34% two-family homes, 7% three-family homes, 17% in buildings of four to nine units and 8% in buildings of 20 or more units. About half were built by 1939. The housing authority’s John J. Duggan Park has 196 units. The share of four-to-nine-unit buildings is notably higher than in Forest Park, which makes Indian Orchard one of the more common places to find small apartment buildings outside the urban core.
The owner-occupied outer neighborhoods
Several outer neighborhoods are where Springfield looks most suburban. The city’s earlier neighborhood profiles, based on 2005 to 2009 survey data, put homeownership at 88.9% in East Forest Park, 78.7% in Sixteen Acres, 74.6% in Boston Road, 64.5% in East Springfield, 63.7% in Pine Point and 54.3% in Liberty Heights. The same profiles put homeownership at 2.6% in Metro Center, 6.2% in the South End, 11.7% in Memorial Square and 13.6% in Brightwood, which shows how persistent the divide between downtown and the outer neighborhoods has been.
The 2011 tornado also reached this part of the city. The disaster recovery report counted 146 single-family homes condemned and 56 destroyed in East Forest Park and Sixteen Acres, and HUD approved $13,906,000 in disaster recovery funds for the city in December 2013.
Apartment buildings in these neighborhoods are scarcer, and an owner here is more likely to compete with single-family rentals and owner-occupied two-families than with large complexes.
What the neighborhood map means for owners
A few patterns stand out for anyone who owns or is evaluating an apartment building in Springfield:
- Location sets the competition. Downtown and the North End buildings compete with large subsidized complexes; Forest Park and Indian Orchard buildings compete mostly with two- and three-family houses.
- Age is nearly universal. With a majority of rental units built before 1950, budgets for heating systems, lead safety, porches and masonry are part of owning almost anywhere in the city.
- Historic districts add steps. Buildings in local historic districts such as Quadrangle-Mattoon, McKnight and Maple Hill can face design review for exterior work.
- Vouchers matter. More than 5,000 Housing Choice Vouchers, as counted in the Consolidated Plan, between the housing authority and Way Finders make voucher administration a routine part of leasing in many neighborhoods.
- Transit is improving. Union Station, Hartford Line service since 2018 and the Valley Flyer, made permanent in October 2022 after its 2019 pilot, strengthen the case for downtown and nearby neighborhoods.
The rail connections deserve a closer look. The Valley Flyer pilot began on August 30, 2019, linking Springfield with Holyoke, Northampton and Greenfield, and the state announced in October 2022 that the Valley Flyer would become permanent. Combined with Hartford Line trains south toward Hartford and New Haven, that gives renters in Metro Center, the South End and Lower Liberty Heights a realistic rail commute to several regional job centers. For owners of buildings within walking distance of Union Station, that is a leasing point worth stating plainly in marketing.
The city is also working on its first citywide housing plan in more than 20 years, which began in January 2026, so zoning and housing policy may shift again soon.
Because these submarkets differ so much, comparing buildings across neighborhoods works best on net operating income rather than on rent alone; our NOI calculator can help. Owners weighing their next step can read our Springfield market page, and those comparing cities can browse other Massachusetts apartment markets.